Grand Rapids Real Estate Market Report March 2023
/in Grand Rapids Real Estate Market/by Andrew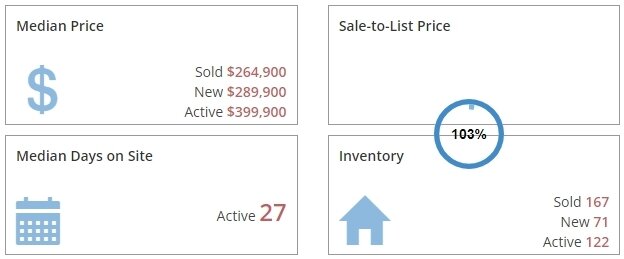
Welcome to our Grand Rapids Real Estate Market Report. Here you will find the current market information for March 2023 as reported by the Grand Rapids Board of Realtors.
Market reports are a useful tool when researching specific areas of town, particularly when selling a home. You can learn about pricing trends, how many days homes last on the market, median prices, sale to list price ratios and more. We also provide a snapshot of homes sold in your market.
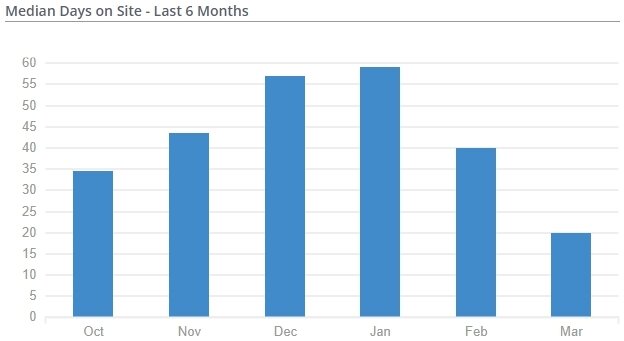
Days on Market March 2023
You can have these market reports sent to your inbox each month for specific areas of town. Follow the link below to the main report page and select the drop down to find your market. If you don’t see your market, we can create it for you. We cover the entire Southwest Michigan area including the Lakeshore.
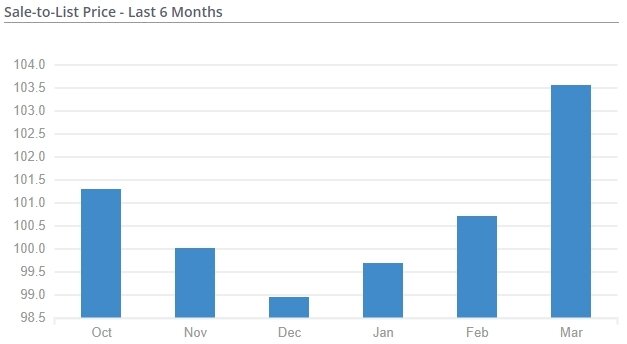
In this latest report for March 2023, buyers are eagerly awaiting listings as inventory remains low. There would be many more homes sold if they were more available homes and condos on the market. The Sales to Listing price ratio is 103.6%% which is up from February’s 100.7%. We are starting to see more multiple offer scenarios again with the low inventory.
Homes and condos are still in demand in certain areas and selling over full price, primarily because of the lack of inventory.
Sale to List Price March 2023
LISTING INVENTORY IS STILL DOWN! We have active, qualified buyers in many markets, including the downtown condo market, that are just waiting for listings. If you are thinking of selling your home or condo, now is a Still a Great time to put it on the market. Please give me a call or fill out the form below and tell us about your home!
The average days on the market for March is 20 days, which is down from 40 days on the market in February, indicating a return to a more seller’s market. Spring is here.
What is Your Home Worth?
if you are thinking of selling your home, let us k ow how we can help.
Sorry we are experiencing system issues. Please try again.
Grand Rapids Real Estate Market Report November 2022
/in Grand Rapids Real Estate Market/by Andrew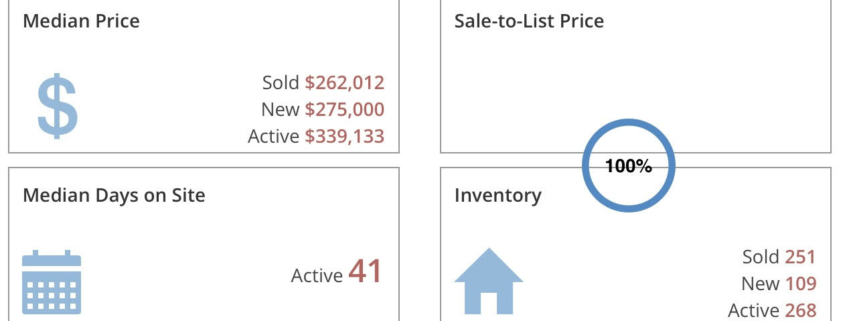
Welcome to our Grand Rapids Real Estate Market Report. Here you will find the current market information for November 2022 as reported by the Grand Rapids Board of Realtors.
Market reports are a useful tool when researching specific areas of town, particularly when selling a home. You can learn about pricing trends, how many days homes last on the market, median prices, sale to list price ratios and more. We also provide a snapshot of homes sold in your market.
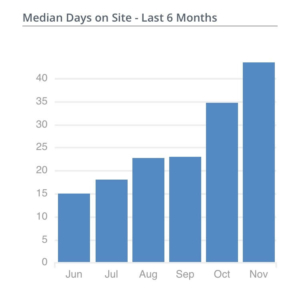
Days on Market November 2022
You can have these market reports sent to your inbox each month for specific areas of town. Follow the link below to the main report page and select the drop down to find your market. If you don’t see your market, we can create it for you. We cover the entire Southwest Michigan area including the Lakeshore.
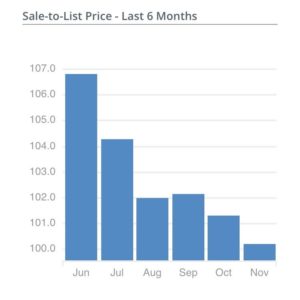
In this latest report for November 2022, as we enter the end of year, we are seeing a slowing market. Buyers are eagerly awaiting listings as inventory remains low. There would be many more homes sold if they were more available homes and condos on the market. The Sales to Listing price ratio is 100.2% which is down from October’s 101.3%. While there are still multiple offer scenarios many areas are returning to a more traditional scene with homes taking longer to sell.
Homes and condos are still in demand in certain areas and selling close to full price, primarily because of the lack of inventory. However we are seeing price reductions as the market has started to slow.
Sale to List Price November 2022
LISTING INVENTORY IS STILL DOWN! We have active, qualified buyers in many markets, including the downtown condo market, that are just waiting for listings. If you are thinking of selling your home or condo, now is a Still a Great time to put it on the market. Please give me a call or fill out the form below and tell us about your home!
The average days on the market for November is 43 days, which is up from 35 days on the market in October, indicating a return to a more traditional market.
What is Your Home Worth?
Please click the image above or tell us about your home!
Sorry we are experiencing system issues. Please try again.
Forest Hills Condos Market Report September 2021
/in Grand Rapids Real Estate Market/by Andrew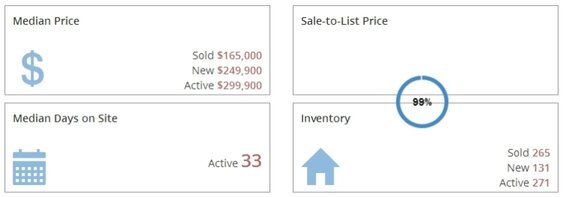
Here is the latest Forest Hills Condos Market Report. Here you will find the current market information for September 2021 as reported by the Grand Rapids Board of Realtors.
Market reports are a useful tool when researching specific areas of town, particularly when selling a home. You can learn about pricing trends, how many days homes last on the market, median prices, sale to list price ratios and more. We also provide a snapshot of homes sold in your market.
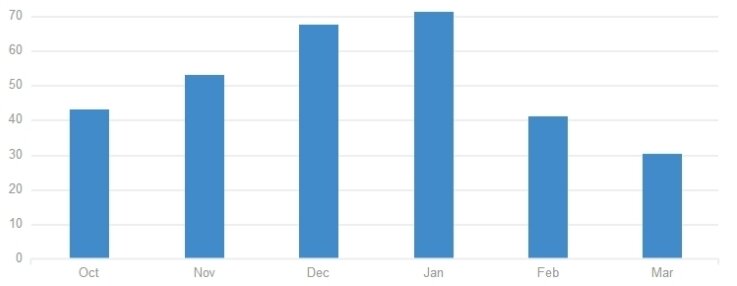
Days on Market September 2021
You can have these market reports sent to your inbox each month for specific areas of town. Follow the link below to the main report page and select the drop down to find your market. If you don’t see your market, we can create it for you. We cover the entire Southwest Michigan area including the Lakeshore.
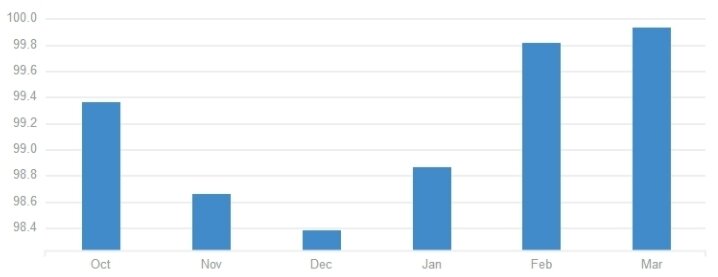
In this latest report for March 2018 as we enter the Spring Market, we are seeing a very active market. Buyers are eagerly awaiting listings as inventory remains low. There would be many more homes sold if they were more available homes and condos on the market. The Sales to Listing price ratio is 99.9% which is up from March’s 99.8%. In many markets, there are multiple offer scenarios with home buyers willing to make up any low appraisal.
Homes and condos are very much in demand and selling close to full price in many markets, primarily because of the lack of inventory. The median price of active listings is $300,000 while the median price of sold property is $164,500.
Sale to List Price September 2021
LISTING INVENTORY IS STILL DOWN! We have active, qualified buyers in many markets, including the downtown condo market, that are just waiting for listings. If you are thinking of selling your home or condo, now is a GREAT time to put it on the market. Please give me a call or fill out the form below and tell us about your home!
There are currently 271 active listings (131 new listings in March) in the market area this report covers, with 265 properties selling. If you are looking for a home or condo, let us help you get notified right away of any new listings.
The average days on the market for March is 30 days, which is down from 41 days on the market in February, again indicating lack of inventory.
What is Your Home Worth?
Please click the image above for an instant value or tell us about your home!
Sorry we are experiencing system issues. Please try again.
Grand Rapids Real Estate By Zips
Real Estate in 49503
Real Estate in 49504
Real Estate in 49505
Real Estate in 49506
Real Estate in 49507
Real Estate in 49508
Real Estate in 49512
Real Estate in 49525
Real Estate in 49534
Real Estate in 49544
Real Estate in 49546
Real Estate in 49548
Real Estate in 49301
Real Estate in 49302
Real Estate in 49306
Real Estate in 49321
Real Estate in 49341
Real Estate in 49418
Real Estate in 49426
Real Estate in 49428
Real Estate in 49315
Real Estate in 49316
Andrew Ingram

|
Real Estate Near Grand Rapids
Ada Township Real Estate
Cascade Township Real Estate
Byron Center Real Estate
Caledonia Real Estate
Downtown Grand Rapids Real Estate
East Grand Rapids Real Estate
Grand Rapids Township Real Estate
Grandville Real Estate
Heritage Hill Real Estate
Hudsonville Real Estate
Jenison Real Estate
Kentwood Real Estate
Northview Real Estate
Rockford Real Estate
Wyoming Real Estate
GR Real Estate $0 - $50,000
GR Real Estate $50,000 - $100,000
GR Real Estate $100,000 - $200,000
GR Real Estate $200,000 - $300,000
GR Real Estate $300,000 - $400,000
GR Real Estate $400,000 - $500,000
GR Real Estate $500,000 - $1,000,000
GR Real Estate Over $1,000,000


